“Interview hoarding” trends unchanged from last year.
Without question, given COVID-19, this GME interview season has been the most unique, challenging, and stressful of recent, memory (and perhaps ever). From the start of the pandemic, it was hypothesized that virtual interviews would lead to increased candidate application, increased program interviews, “hoarding” of interviews amongst “top” candidates, and significant interviewee overlap amongst programs, leading to a larger number of unmatched candidates and unfilled programs.
Over the past few weeks, we have noticed an amplification of these concerns via discussions and communications across specialty and leadership organizations. This includes a recent letter on the American College of Surgeons website postulating a possible “match crisis,” correspondence from the American Association of Medical Colleges (AAMC), and other concerns expressed across GME specific online groups, listservs and communities including Twitter, Facebook and Reddit.
At Thalamus, we have been closely following these discussions and are eager to help where we can. Given we collaborate with over 2,000 ACGME accredited (and non-accredited) residency and fellowship programs, across over 200 institution and 100 specialties, and greater than 90% of applicants, we have data to share that will shed light on the issue. Similarly as a grassroots organization of former applicants, program coordinators, and program directors, we are passionate about promoting transparency and innovating this process for GME, such as in sharing our Residency Program Interview Best Practices Guide. While it has been our regular routine to share data at the end of interview season and in peer-reviewed publications (more on this to follow soon…), our team talked over the weekend and felt compelled to share a sneak peak of what the data tells us to-date.
(TL;DR) In reviewing interview data at Thalamus, this virtual interview season has shown no significant difference in overlap of interviewees across programs throughout the major residency specialties, nor a change in distribution of interviews offered amongst candidates.
Conclusion: The 2020-2021 virtual recruitment season shows no discernable deviation in interviewee recruitment data compared to last year.
The more detailed answer:
- There is no significant difference in the overlap of interviewees across programs throughout the majority of residency specialties.
- The is no significant difference in the mean percentage of interviewee overlap for each specialty when comparing programs that used Thalamus both this season (2020-2021) and last season (2019-2020).
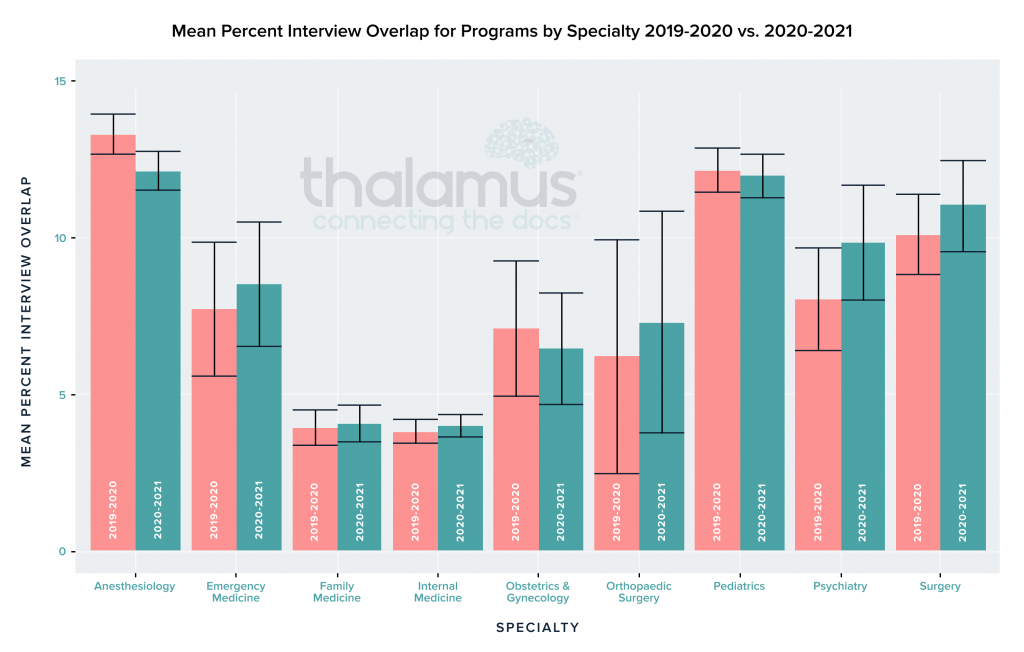
What does this graph show? For each specialty denoted on the x-axis, if you were to select any two residency programs at random, the average amount of overlap in applicants that interviewed at both programs is displayed on the y-axis as a percentage.
As shown:
- There is no significant difference in this value across years in any given specialty.
- There is variation across specialties likely due to specialty competitiveness, size of program and applicant pools, residency class size and recruitment behaviors.
- The amount of overlap between any two programs, in any of the 9 specialties, is less than 15% on average.
What does this mean? While programs appear to be inviting more candidates given the increasing number of applications and the virtual nature of this interview season, programs are interviewing distributed and diverse complements of applicants within each specialty. In other words, programs are NOT all inviting the same candidates.
- There was no significant difference in the mean percentage interviewee overlap for programs in each of these specialties for all programs using Thalamus in 2020-2021.
The above analysis included only those residency programs that used the Thalamus software in both the current and prior recruitment seasons. Thalamus experienced significant growth over the last year, increasing in size in number of programs by over 400% during this period (Conversely, the size of our applicant pool has remained essentially fixed given the wide distribution of candidate applications and interviews). Thus, we also included the same analysis as above, but for all residency programs using Thalamus in these 9 specialties for the current recruitment season (regardless of whether they used Thalamus last season).
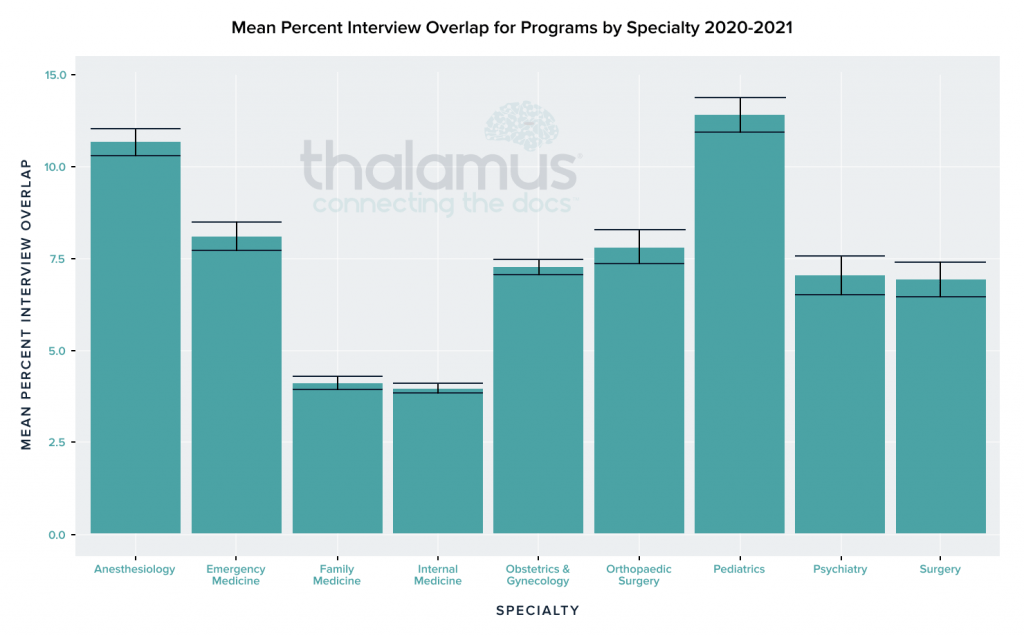
What does this graph show? For the 2020-2021 applicant season, for each specialty denoted on the x-axis, if you were to select any two residency programs at random, the amount of overlap in applicants interviewed by those two programs is displayed on the y-axis as a percentage.
As shown:
- There is variation across specialties likely due to specialty competitiveness, size of program and applicant pools, residency class size and recruitment behaviors.
- The amount of overlap between any two programs, in any of the 9 specialties, remains less than 15% on average, and in many specialties decreased further.
What does this mean? For the 2020-2021 recruitment season, residency programs are NOT all inviting the same group of candidates for interviews, and the process remains as distributed as a regular, non-virtual year.
*Note: Thalamus works with 20-50% of programs within each of the specialties above, across all regions and divisions, across 47 states and over 300 cities, ranging in size from large academic medical centers to rural community hospitals.
- There is no significant difference in the distribution of the number of interview invitations received by candidates on average.
Thalamus analyzed interviewee data across programs that used Thalamus in the current and prior recruitment season incorporating a total of approximately 18,000 applicants in each year. The results showed no change in mean number of interviews offered, interviews received by candidates at the 90th percentile for number of interviews received, nor the maximum number of interviews received by a candidate.
Distributions for Pediatrics and Anesthesiology are shown below as examples, although the curves are similar across all 9 specialties (taking into account specialty competitiveness, size of programs, contiguous ranks needed to match, etc.).
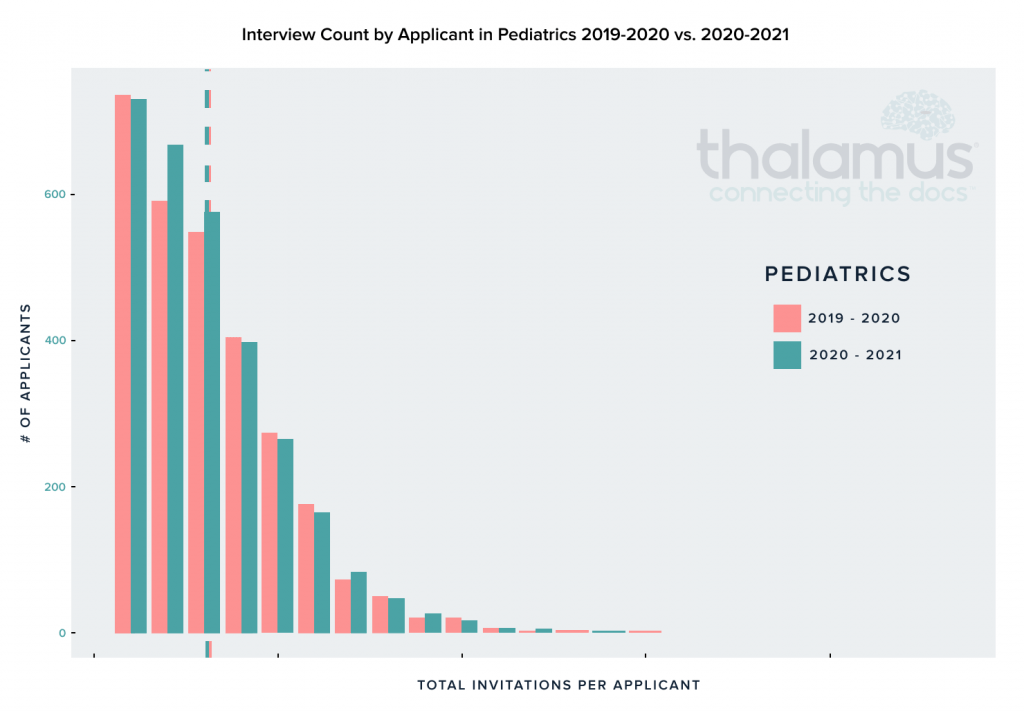
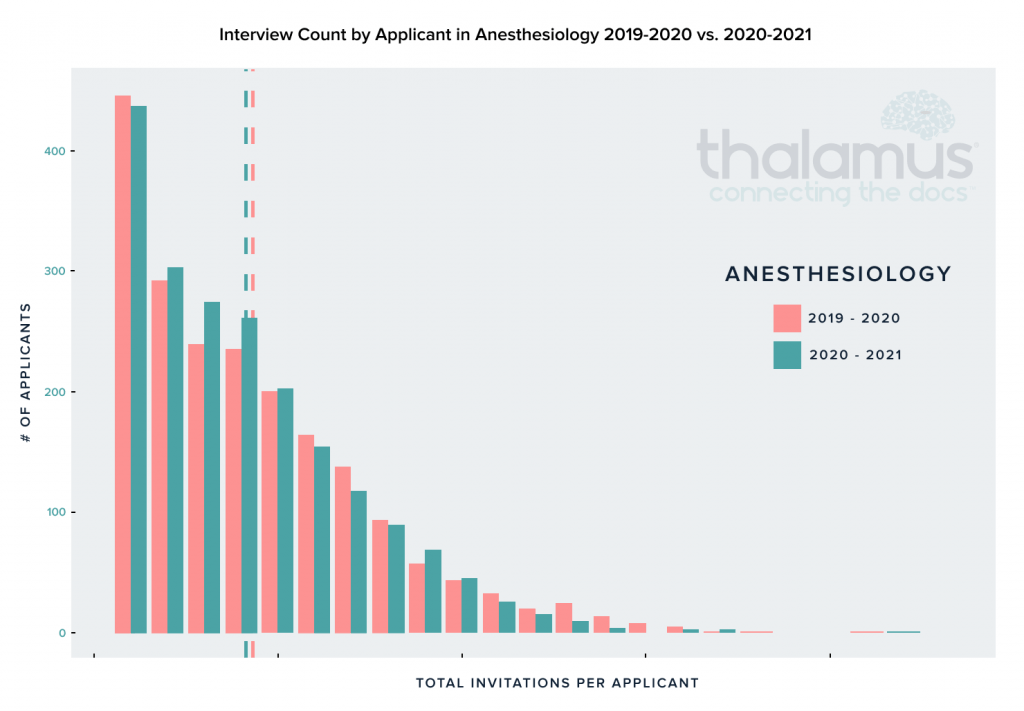
Note the hashed lines represent the mean within each specialty.
As this specific analysis includes on those programs that used Thalamus in the current and prior recruitment seasons and contain a subset of programs (~60 programs for each specialty presented), they are included to illustrate the key point that the distribution of interviews amongst candidates has not changed from the year prior. In fact, the means are nearly identical.
If anything, one unique finding in both pediatrics and anesthesiology is that more unique candidates are getting interviews (albeit a small amount),. The number of candidates receiving a large number of interviews has remained fixed. Which means the distribution is more equitable than it was last year (the effect is small, but it is there).
Similarly, when comparing the entirety of the 2020-2021 Thalamus applicant pool (without the limitation of programs using Thalamus in both 2019-2020 and 2020-2021), there was no change in the ratio of number of interviews received by the candidate at the 90th percentile for number of interviews compared to the number of interviews received by the candidate at the 100th percentile (top interview receiver within the specialty), with an n = 29,142 applicants. This was normalized to the growth in number of programs using Thalamus and the ratio remained unchanged.
What does this analysis show?
- There is no significant difference in the mean number of interviews received by applicants nor the distribution of applicants between years (2019-2020 vs. 2020-2021) and for this year alone for any given specialty.
- Candidates at the 90th percentile are receiving the same number of interview invitations per program applied as in prior years.
- Candidates at the 100th percentile are receiving the same number of interview invitations per program applied as in prior years.
- There is a greater number of candidates with limited interviews amongst specialties, while candidates with a large number of interviews remained fixed, suggesting a more slight increase in the diversity and size of the candidate pool.
What does this mean? The distribution of interviews received across all candidates appears unchanged from prior years. Additionally, while there are candidates who are receiving a large number of interview invitations within a given specialty (>20-30 interviews), the frequency of such candidates is unchanged from prior years when compared to the overall applicant pool.
While there have been a lower number of cancellations this interview season to date, this is not only due to the ease of interviewing in a virtual setting vs. traveling to in-person interviews, but also due to the fact that the start of the season was shifted by 5 weeks (from September 15th to October 21st). As such, the cancellation curve for this season has shifted to later in the season, and it is expected that cancellations in January and February will occur, barring whatever change in behavior occurs over the current concern for “interview hoarding.”
So what implications does this have for the match? As we are still in the middle of the recruitment season, it is of course, challenging to predict match outcomes. The match will ultimately be determined, as always, by the Match algorithm, which prioritizes applicant-facing preferences against program preferences. However, there is nothing markedly different in this year’s data compared to the prior year’s to suggest an unusual outcome, assuming applicants and programs utilize similar historical ranking and match strategies.
So what does Thalamus recommend?
Our recommendations are as follows: Treat this year as you would any other match year.
- Applicants:
- Recognize that there are some candidates that have received 50+ interview invitations. However, this is well above (by several standard deviations) the average within any given specialty. Additionally, that person can only match at one program (at most). And that person would still have had 50+ interview invitations in prior years as well (this is a different challenge that also needs to be analyzed and discussed further).
- If you are a candidate that has a large number of interviews, please recognize that you are likely in the top 1-10% of candidates in your specialty with that large of a number of interviews. This means your chance of matching is very, very likely. If there is a program that you would not want to match at (or would be very unlikely to rank) please consider cancelling that interview in favor of a colleague (however this burden should not be put on you nor are we suggesting such).
- If you have a low number of interviews and are concerned that you may not match, we recommend meeting with your advisory dean or other support services to determine a plan going forward.
- Enjoy your holiday break. Match Day is still 3 months away. And despite the virtual interview season, the data appears to represent the usual status quo rather than an anomalous recruitment season.
- Program Leadership + Medical School Advisory Deans:
- Be mindful of and share the data presented above.
- Understand that candidates with many interview invitations are in the same proportion as prior years.
- Recognize that recruitment strategy from prior years will likely result in similar match outcomes this year. It is tempting to invite more candidates, however, programs should not overreach for candidates with low likelihood of matching. Consider key drivers of matching, such as geography, vs. blanket inviting of additional candidates to increase numbers.
- For students at risk of not matching, provide them support and guidance as always.
- For students with many interviews, encourage them to consider the above data to make individualized decisions on how many interviews they would feel comfortable attending.
It is our hope that the above information has provided data-driven and evidence-based information regarding the state of the 2020-2021 residency recruitment season. Despite its unique virtual format, this recruitment season currently seems quite similar to prior interview seasons from a data perspective. Please share this information with students, advises, mentees, mentors, program and GME/UME leadership, and others throughout the GME community.
Together, we can make this recruitment season a success.
-Team Thalamus
