Methodology for creation and processing of a novel Transcript Normalization Tool in Cortex Application Screening and Review Platform
Learn how Thalamus AI Insights standardizes medical school transcripts for ERAS 2026, improving fairness, consistency, and efficiency in residency review.

Standardizing core clerkship grades across medical schools through Thalamus AI Insights to support fair, consistent, and equitable application review.
Last updated: September 29, 2025
Original methodology posted: September 28, 2024
At Thalamus, we continue to build on our philosophy that AI should amplify human insight - not supplant it - in graduate medical education (GME). As outlined in Artificial Intelligence: The Thalamus Way, our philosophy emphasizes transparency, fairness, and inclusivity.
For the 2025 Electronic Residency Application Service ® (ERAS®) season, we introduced a novel transcript normalization tool - the first feature launched under Thalamus AI Insights to provide programs with a structured way to interpret and compare core clerkship grades within and across medical schools. This innovation leveraged large language model (LLM) technology to standardize course names and grading distributions, while surfacing percentiles and grade profiles that reduce the burden of manual transcript review.
Now enhanced for the 2026 ERAS Season, this methodology document details the updated design, logic, and validation process behind transcript normalization in Cortex. The core challenge remains the same: medical school transcripts vary widely in format, grading scales, and reporting standards. By normalizing this unstructured data, we reduce cognitive load on reviewers and promote more equitable comparisons across applicants from a wide variety of institutions and backgrounds.
For this cycle, we have refined our model architecture, expanded the catalog of medical schools and grading schemas, and upgraded to include the GPT-5o-mini model for increased accuracy and efficiency. Real-time validation has also been strengthened to provide programs with more reliable percentile and grade distribution data. Together, these enhancements make transcript normalization an even more powerful tool to support fair, consistent, and data-driven review in the transition to residency.
For clarity, this tool does not provide any form of automated decision making.
As with all Thalamus AI Insights features, transcript normalization will continue to evolve with community feedback and real-world validation, ensuring that innovation remains grounded in transparency, inclusivity, and the values of the GME community.
I. Background
The availability of objective and standardized metrics used to differentiate applicants has been a long-established challenge for programs in graduate medical education. This includes the United States Medical Licensing Exam (USMLE) Step 1 and Comprehensive Osteopathic Medical Licensing Exam (COMLEX) Level 1 transitioning to pass/fail scoring systems in 2022.[1],[2] This change, in particular, created additional difficulty for program directors to assess and compare applicants’ academic performance on a uniform scale, leaving them with limited options, such as USMLE Step 2 CK scores, COMLEX Level 2-CE scores, and/or the perceived prestige or ranking of the medical school as potential alternatives, This has led to concerns about fairness and consistency in the residency selection process.[3]
Standardized letters of evaluation (SLOEs) have also gained favor in various specialties. SLOEs function as additional tools to assess academic and clinical performance in a more uniform manner. However, the information and standards provided in SLOEs are variable and so objective metrics remain scarce.
Historically, the Medical Student Performance Evaluation (MSPE) or “Dean’s Letter” has functioned as a “Summary letter of evaluation intended to provide residency program directors an honest and objective summary of a student’s salient experiences, attributes, and academic performance.”[4] The Association of American Medical Colleges (AAMC) Group on Student Affairs (GSA) Committee on Student Affairs (COSA) MSPE Effective Practices Working Group last released major recommendations in 2016 and then provided updated guidance in May 2022 following disruptions in medical education due to COVID-19.
While the MSPE has added some standardization of student academic performance, there is inconsistency in format and content by medical schools. What is defined as a required “core clerkship,” one that provides medical students a supervised training period with hands-on experience in patient care, also differs by medical school and specialty discipline.[5] Additional variability includes non-standard grading scales (categorical, letter, numerical, etc.) and grading distributions within and across medical schools. This makes understanding and comparison of grades difficult, requiring manual intervention that increases program director and other evaluator review time. This may also lead to an overreliance on letters of recommendation or other information provided by medical schools (or letter writers) that are well-known to the reviewers, enhancing the potential for bias and disadvantaging applicants from lesser known or newer medical schools.[6]
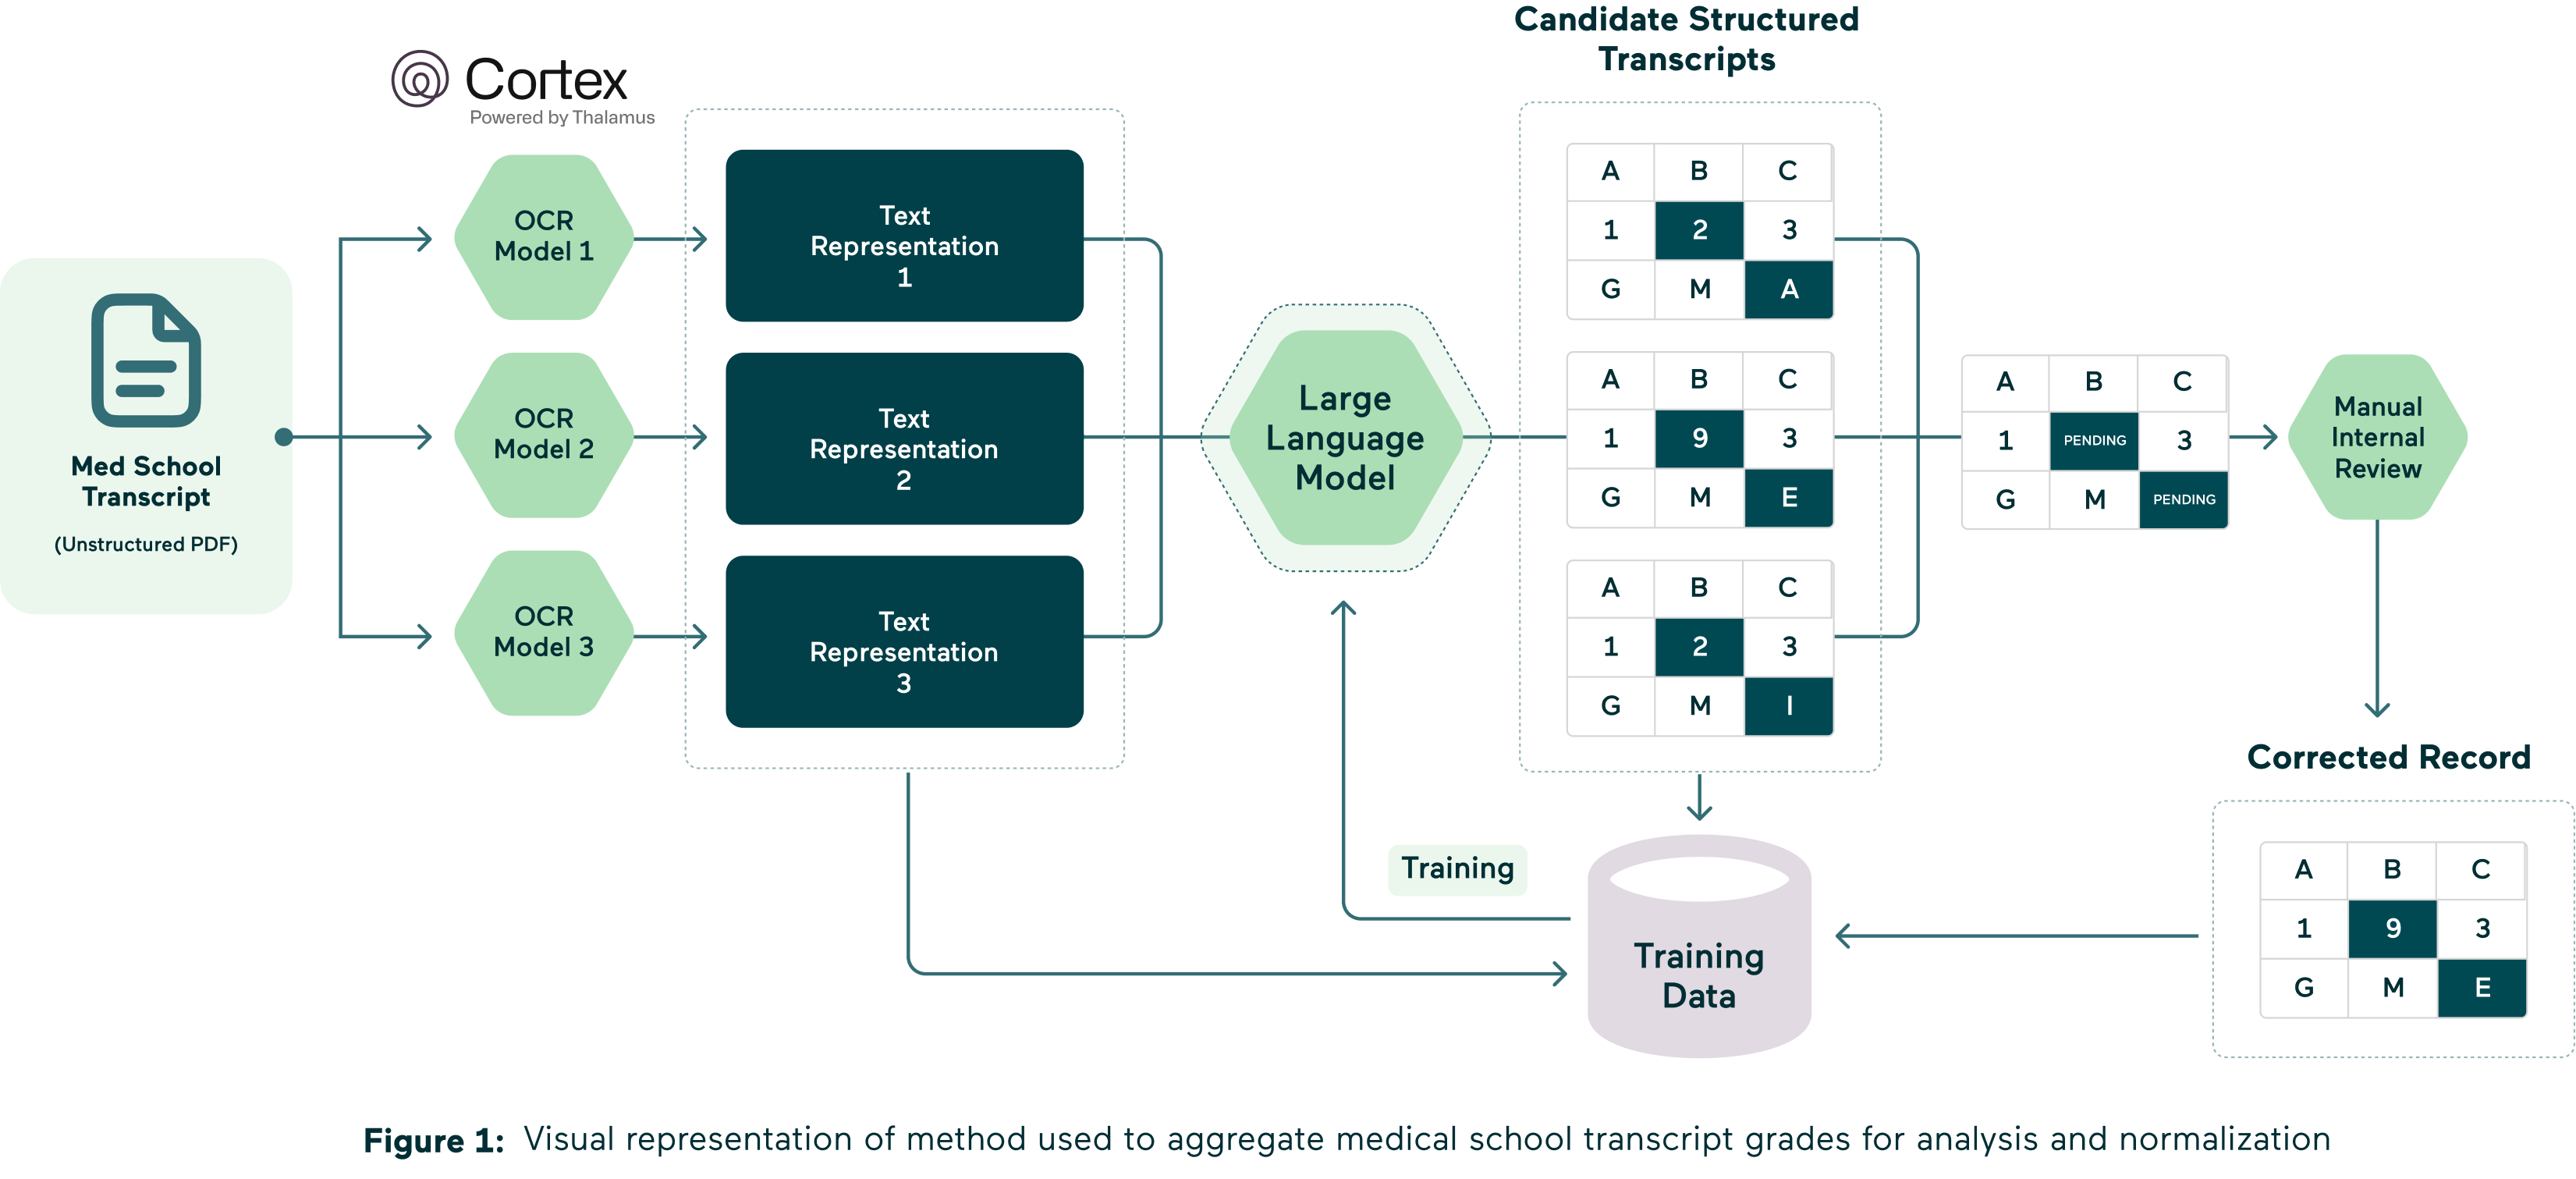
To address these concerns and to provide more objective comparison, Thalamus developed a novel transcript normalization tool. This feature utilizes a large language model (LLM) to provide a standardized method for aggregating and parsing transcript data evaluating medical school grades at scale, and thus aids residency programs in making more objective, equitable and data-driven decisions to promote further equity in the transition to residency.
Key features of this novel transcript normalization tool support analysis of grades and include:
- Standardization of course naming
- Standardization of course grading and distributions across medical schools.
- Percentile rank of applicant core clerkship grades for comparison within/across schools.
Updates for 2026 ERAS Season
- Model refinement and upgrade from GPT-4o-mini to GPT-5o-mini
- Expanded catalog of medical schools and grading schema
- Improved real-time processing and data validation
II. Introduction
This document outlines the methodology behind the development of the updated transcript normalization tool within Thalamus’s Cortex application screening and review platform. The tool aims to standardize and normalize medical school transcripts and core clerkship grades to facilitate more efficient and equitable application screening and selection for GME programs.
The feature was first created through a year-long grassroots collective involving data scientists, AI/ML experts, and medical education researchers and technologists. A proof of concept was built and presented in November 2023 at the AAMC Learn Serve Lead (LSL) Conference in Seattle, WA, and launched in September 2024 for the 2025 ERAS residency recruitment season. The tool has been further enhanced through discussions with and insight provided by specialty society, residency program, and institutional leadership at various academic conferences, forums, and webinars.
III. Objectives
The primary objective of the transcript normalization tool is to standardize academic information across medical schools by converting unstructured medical school transcripts into a structured format, thereby increasing consistency in evaluating applicants from diverse educational backgrounds, medical school types, geographies, and practice environments. By doing so, the tool aims to streamline the residency application process, reduce bias, and enhance the fairness of application evaluation.
This document was created to provide programs and applicants with a transparent view into how the feature works, consistent with Thalamus’s commitment to product inclusivity, accessibility and fairness. As a mission-driven Public Benefit Corporation (PBC), Thalamus continues to commit to efforts like these to promote its public benefit purpose, “Of ensuring greater access to affordable, high-quality medical education and training, addressing systemic inequities in the physician workforce, and delivering better healthcare outcomes for patients and society.”[7]
IV. Methods
1. Data Collection and Analysis
a. Transcript Selection
To build a comprehensive and inclusive normalization tool, Thalamus identified the entire population of medical school transcripts and grades for residency applicants to the 2024 and 2025 ERAS cycles (September 2023 – March 2025). This population was further narrowed to include a subset limited to all US MD (allopathic) and DO (osteopathic) granting medical schools, as well the international medical schools with the largest number of applicants that participated in the US residency match process. 10 applications were analyzed from each medical school for the initial data set, and coverage has been iteratively refined and increased over time.
This list of institutions was selected for the prototype as they historically represent the highest frequency medical schools in ERAS, accounting for the majority of applicants, whereby adding the next incremental medical school only results in an additional marginal percentage increase in applicants being considered.
b. Manual Review and Mapping of Core Clerkships
i. Determination of Core Clerkships
A team of Thalamus subject matter experts (SMEs) manually reviewed a wide array of transcripts to identify and map the most common core clerkships across medical schools. This manual review was essential to understanding the variations in transcript formatting and nomenclature across each institution.
A “core clerkship” represents a standardized set of clinical experiences that are central to medical education and residency training readiness. Thalamus SMEs determined the following list to be the most inclusive and equitable, given frequency and known importance in medical education. The percentage of medical schools in the sample which includes each core clerkship is presented in parentheses.
Cortex Defined Core Clerkships:
- Internal Medicine (99.5%)
- Surgery (99.5%)
- OBGYN (99.5%)
- Pediatrics (99.5%)
- Neurology (56.7%)
- Psychiatry (99.1%)
- Family Medicine (86.0%)
Other core clerkships were observed in the analysis but were excluded due to low frequency (i.e. <20%) across the medical schools in the sample. These included Ambulatory and/or Primary Care, Longitudinal Primary Care, Osteopathic Manipulative Medicine (OMM), Anesthesiology, Emergency Medicine, Rural Medicine, Cardiology, Geriatrics, Radiology, Addiction Medicine, Hospice and Palliative Care, Ophthalmology, Clinical Bioethics, Population Health, Critical Care, Orthopaedic Surgery, Pathology, Otolaryngology, Medical Humanities, and Dermatology.
ii. Mapping of Core Clerkships
The analysis of core clerkships resulted in 1:1 mapping relationship between transcript grade, course name and course code, except for the following conditions:
- Some osteopathic and international medical schools have multiple core clerkships across each specialty/discipline (e.g. Internal Medicine I, Internal Medicine II, Surgery I, Surgery II, etc.). In this case, each clerkship grade is shown consecutively, concatenated with a comma (e.g. “Internal Medicine H,HP” etc.).
- Some allopathic, osteopathic and international medical schools “cluster” multiple core clerkship, into a singled “clustered clerkship” (e.g. Neurology, Psychiatry and Family Medicine are presented as a cluster with a single grade). In this case, this single defined grade was mapped to each corresponding Cortex defined clerkship.
iii. Grading scale determination
Cortex supports the most common grading scales used by medical schools. These included several permutations of categorical (e.g H/HP/P/F, H/P/F, H/NH/P/F, P/F, etc.), letter (e.g. A/B/C/D/F, A/B/C/F, etc.) and numerical grades (100/99/98/97…, etc.). As some schools use numerical grades that are then calculated into a categorical or letter grades, the final grading scale was confirmed by either the official grading information listed in the medical school transcript or MSPE, and/or following broader manual transcript review.
2. Optical Character Recognition (OCR) and Initial Data Processing
a. OCR Implementation
All medical school transcript PDFs were processed to extract structured text data. For machine-readable transcripts, text was directly parsed and normalized without modification. For non-machine-readable transcripts, advanced Optical Character Recognition (OCR) powered by a Large Language Model (LLM) was applied to convert unstructured image-based data into text. The LLM-based OCR was carefully tuned to accommodate the wide variety of formats, fonts, and layouts found across different medical schools.
- OCR Model: The LLM was used to directly interpret and transcribe image-based transcripts, providing context-aware recognition of complex content such as medical terminology, abbreviations, and non-standard layouts. This approach significantly improved transcription accuracy compared to traditional OCR engines like Tesseract. However, when a transcript scan is too poor for reliable normalization, for example, when it is handwritten, highly distorted, or of very low image quality, results may be incomplete or inaccurate. To safeguard downstream processes, any transcript output that fails to meet a minimum character threshold, which serves as a marker of parsing quality, is excluded from further processing and not displayed.
- Quality Control: Each batch of OCR output underwent a rigorous quality control process. Automated checks were combined with manual human review to identify and correct errors, continuously improving model performance. This multi-step validation was used to improve the quality and reliability of transcript data flowing into admissions and verification workflows.
b. Text Representation Output
The OCR process resulted in a machine-readable text representation for each transcript. This structured text served as the foundation for further data processing, analysis, and normalization.
3. Machine Learning and Large Language Model (LLM) Processing
a. LLM Utilization
The machine-readable text representations were processed using an LLM, initially specifically the GPT-4o-mini model, now including the GPT-5o-mini (2026 ERAS season) hosted on Microsoft Azure and OpenAI.[8] This solution was selected given Thalamus utilizes Microsoft Azure for cloud hosting and has an enterprise agreement with them, as well as with OpenAI, which improves overall data and model security. Through this contractual relationship with Microsoft and OpenAI, neither the data input, nor the trained model is publicly utilized or used to train any other GPT solution outside of Thalamus. This solution was fully vetted by Thalamus’s data security and compliance teams. The LLM was directed through customer prompting to recognize and categorize key components of medical transcripts, such as course names, clerkship titles, grades, and other pertinent information.
- Model Training and Iterative Refinement.
- Model Training: The model was initially trained on a dataset derived from the manual review and mapping process, ensuring it was grounded in a realistic understanding of the data.
- Iterative Refinement: The model underwent multiple iterations, each time refining its accuracy and reliability based on feedback from human reviewers.
4. Human Review and Model Refinement
a. Manual Review of Model Outputs
Following the LLM processing, “candidate-structured transcripts” were generated and then reviewed by multiple human reviewers. This step was crucial for:
- Identifying Inaccuracies: Reviewers corrected any inaccuracies or inconsistencies in the LLM's outputs, promoting higher levels of data fidelity.
- Providing Feedback for Retraining: Corrections and observations from the human review process were used to further train and refine the model, enhancing its accuracy and adaptability to various transcript formats.
5. Quality Assurance and Model Validation
After the manual review and retraining phases, additional quality assurance measures were implemented to promote the final structured transcripts were accurate and reliable, including:
- Cross-Verification: Structured transcripts were cross-verified against the original unstructured versions to ensure all pertinent information was captured correctly.
- Random Sampling and Validation: Randomly selected transcripts were reviewed in detail to ensure consistency/accuracy and filtered through a standardized rule set. This maximized the medical school transcript coverage whereby the reported grade presented to program users in Cortex would be 100% using this standardized rule set. A stratified, random sample of medical schools was used to ensure that each medical school was as equally as represented in the dataset.
- Automated Testing and Metrics: Automated tests were conducted against a dedicated validation set to evaluate model performance objectively. Key performance metrics, such as accuracy, precision, recall, and error rates, were tracked over time. These metrics provided quantitative insight into model reliability and guided further refinements to improve OCR output and parsing quality before production deployment.
6. Model Projection onto Future Transcripts for the 2026 ERAS Season (September 2025)
To promote the robustness and reliability of the transcript normalization tool across academic years and to continuously validate performance across new datasets, the model was used to analyze all residency applicant transcripts received (to-date) for the 2026 ERAS season. This was accomplished through a daily iterative process, up to and including all transcripts received by season opening at 9am ET on 9/24/2025. Transcripts received after that date/time were included on a continual basis every hour, following receipt of the transcript from ERAS.
This projection served three main purposes:
- Accuracy Determination: Given this transcript normalization tool is being updated for the 2026 ERAS residency application cycle, by applying the model to the latest version of medical school transcripts, we were able to assess performance and accuracy in real-time, with newly formatted or updated transcripts. This process involved additional cross-verification, random sampling and validation.
- Continuous Improvement: The insights gained from this validation step were used to further refine and retrain the model, while addressing any new discrepancies or errors and incorporating updated transcript formats or grading standards that may have emerged. Program users may also submit error corrections identified while using this tool through the process discussed at the end of this document.
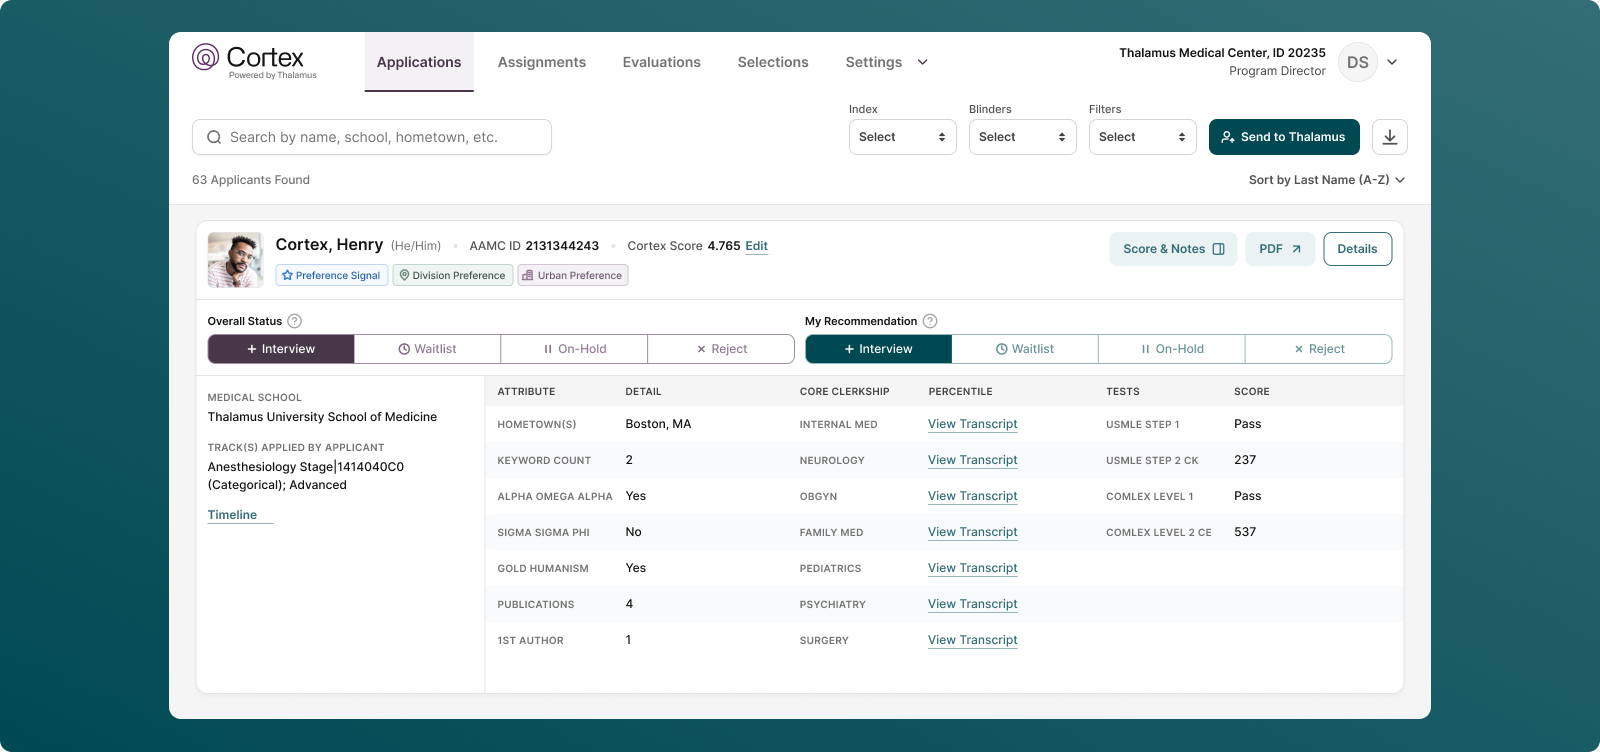
- Create Grading Profiles for Each Applicant: For every applicant for which a transcript was analyzed for the 2026 ERAS season, a grading profile was created to include grades for each of the 7 Cortex Defined Core Clerkships (where applicable/available). Each known and verified applicant grade for each clerkship is presented in the summary view for each residency program utilizing Cortex to screen and review applicants. These grades were also used and included in the grading distribution calculations described in the next section.
7. Analysis and Determination of Grade Distributions
Understanding and normalizing the grade distributions for each core clerkship is essential for providing residency programs with a comprehensive and comparable view of applicant performance within and across medical schools. This analysis was conducted across several dimensions, based on the core clerkship grade profiles by applicant (by medical school) described above.
Each applicant’s core clerkship grade was included to determine the grade distribution for that core clerkship at their medical school (of graduation) or affiliated training site. For applicants that attended more than one medical school, only the transcript from the medical school they graduated from was included in the analysis.
As the tool is further developed, we will also analyze grading trends over multiple academic years to detect any shifts or changes in grading practices. This longitudinal analysis will assist with further model refinement and also assist residency (and fellowship) programs in understanding whether changes in student performance are due to actual differences in competencies or evolving grading standards.
8. Grade Displays: Parameters, Interpretation and Minimum Values
For each core clerkship a student’s grade will display in Cortex as long as 1) the student’s medical school has a defined and mapped Cortex Defined Core Clerkship, 2) Cortex was able to read and determine the grade. For clarity, the frequency of parsed core clerkships in the test sample is assumed to be random and representative of the broader population, therefore the accuracy of both the test and population will also be similar.
In the event that these conditions are not met, and Cortex is unsure of or unable to assess the grade with the minimal defined level of accuracy or minimal character threshold, a link showing “View Transcript” will be displayed in place of the grade. Selecting this link will navigate the reviewer to the applicant’s raw transcript PDF for further review.
Additionally, a 1) grade percentile rank and 2) grade distribution graph will display (as long a minimum threshold is reached on the latter).
For each of these analyses, a minimum threshold of applicant grades per medical school per core clerkship per academic year was determined to be required to display an applicant’s grade percentile and grade distribution graph in Cortex. If the minimum threshold is not met, no percentile or grade distributions will display. This was determined by Thalamus’s research and development team to ensure statistical significance and meaningful insights based on the grading distribution.
Note: For medical schools where there are multiple core clerkships across each specialty/discipline (e.g. Internal Medicine I, Internal Medicine II, Surgery I, Surgery II, etc.), in the current iteration, no percentile or graph will display. In this case, each clerkship grade is shown consecutively, concatenated with a comma (e.g. “Internal Medicine H,HP” etc.). In a future iteration, we are working with the community to understand if multiple graphs would provide helpful context.
The grade percentile rank and grade distribution graph displays as follows:
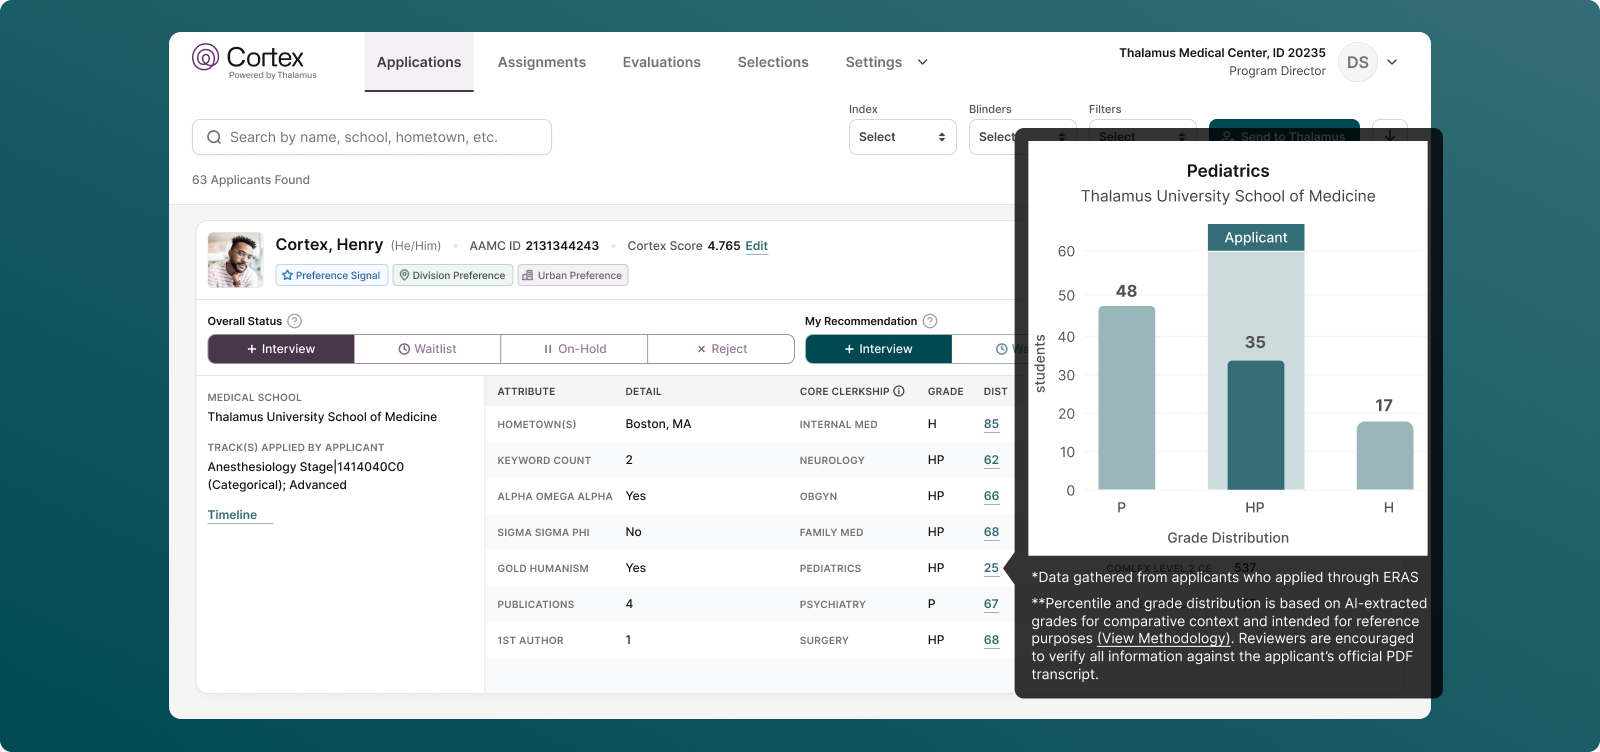
- Interpreting Grade Percentile Ranks: For each core clerkship grade, Cortex will display a percentile rank next to each student’s grade, denoting the percent of students who received the same grade or lower at that medical school for that academic year and defined sub-cohort. In other words, if a medical school grading is determinable on a semester or trimester basis, students within the same semester or trimester are compared against each other. If the academic or calendar year is the minimally determinable time unit, students are compared on that scale. This was determined to be the most equitable manner within which students could be compared, as it best mirrors the mechanism for grading determination of students as they progress through a core clerkship block (as available). This was supported by community feedback we received during the 2025 ERAS cycle.
- Percentile Determination: Grade percentile ranks are based on the number of transcripts of students applying to and received by ERAS from that medical school and the accompanying sub-cohort (defined by minimally reported time unit as described above). For each discrete sub-cohort, the percentile is determined using the mathematical midpoint of each binned category from students in that sub-cohort. For example, in Fall 2024 or Academic Year 2023-2024, 80% of students passed a course, and 20% of students failed a course, the percentile rank of passed and failed scores would be 60 and 10 respectively (for students who received the corresponding grade during the defined period).
Program directors and other evaluators can use these percentile determinations to compare applicant’s performances relative to their peers within the same school and against students from other institutions.
- Grade Distribution Graphs: A graph is created and made available displaying the distribution (for the corresponding core clerkship) of all grades earned by all students applying to ERAS from that medical school.
Each graph will display the core clerkship name and medical school name in the title. The x-axis will include the grading scale for that particular medical school, and the y-axis denotes the number of students at that medical school receiving that grade in the specified core clerkship (and that applied via ERAS for that application cycle). The grade that the corresponding applicant received will be highlighted in a box on the graph that is labeled “applicant.”
Note: This may or may not vary from the graphs presented in the corresponding medical school’s MSPE for that academic year, as schools have different policies on the data that is presented (and which students are included), and may have varying numbers of applicants who completed combined degrees (e.g. MD/PhD, MD/MBA, etc.), completed research or gap years, are applying through other application services and/or forgo the application process entirely.
As above, it is important to note that Grade Percentile Ranks for each student for each core clerkship is calculated based on the sub-cohort defined by the minimally determinable time unit on each medical school’s transcript (i.e. semester, trimester, or academic year, etc., whichever is shorter). Conversely, the Grade Distribution Graphs are a blended cohort of all grades earned by all students applying to ERAS from that medical school. As a result, students receiving the same core clerkship grade may have different calculated percentiles, when compared to a peer receiving the same grade (i.e. they are from different sub-cohorts). Thereby, within each bar/cohort of the histogram, students may also have varying percentiles (because it is creating a blended cohort of students who took the course at different times). The graph is meant to provide a relative visual position of the student’s performance based on the grade received.
By implementing these analyses and continuously validating the tool’s performance, Thalamus AI Insights aims to provide Cortex users a reliable and objective framework for residency selection, helping program directors and evaluators make informed decisions based on a comprehensive understanding of applicant performance.
V. Limitations
While the transcript normalization tool offers a novel, innovative and more objective approach to evaluating residency applicants, there are inherent limitations in these methods predominantly due to the vast variability in medical school grading practices. Users of this feature are advised to use this tool as a guide for comparison but still consider the entirety of every application to facilitate holistic review. This also acts as a countermeasure to automation bias and should also include grit and positive growth signals (not just potential application “red flags” or “blemishes”). There are several helpful resources for residency programs to holistically consider the “whole” applicant.[9],[10]
As you make use of this tool, please use caution when comparing grades for applicants across years or schools. Remember that even with perfect grade normalization, applicant performance would still not be fully comparable due to several of the following reasons including:
- Medical school curricula and overall educational philosophies are non-standardized, including within and across allopathic, osteopathic and international medical schools.
- Some medical schools tend to award honors more liberally, while others use a simple pass/fail system, making it difficult to create a uniform standard for comparison.
- Some medical schools have gone to clustered grading (i.e. combining multiple core clerkships into a single grade).
- Grades are determined at medical schools using variable criteria, as well as a diversity of evaluator types, roles, quantity, and frequency. Shelf and other exam weighting, and other elements of final grades vary throughout.
- The overlap (or lack thereof) of information that is displayed on a medical school transcript vs. medical school performance evaluation at any institution varies.
- Medical students are usually randomly assigned the sub-cohort as to when they complete any core clerkship (from the first to last clinical rotation completed), and therefore are usually evaluated against a sub-cohort of their peers vs. their entirety of their class (which was the driving factor for grade percentile ranks being calculated by sub-cohort).
- Additional variability may be inserted for students pursuing combined/multiple degrees or other breaks in education.
- Core clerkships are offered over a variety of practice environments and geographies, even at the same medical school.
International medical graduates (IMGs) face additional methodological limitations. While Thalamus builds with a focus of and commitment to product inclusivity and has expanded transcript coverage for all medical schools (including international medical schools) for the 2026 ERAS season, broadening coverage of international medical schools continues to face limitations (listed below).
The population of this study included international medical schools with applicants that met the frequency threshold described in the methods section. The current implementation emphasizes accuracy and thus the focus is on schools where accurate results could be provided with high confidence. As there are thousands of medical schools globally, additional work is being done to incorporate more schools as the project expands. This is why we include the “View Transcript” link next to any grade we cannot aggregate, display or normalize. We strongly encourage program directors to consider all applicants holistically, including those whose transcripts we are unable to normalize due to factors outside of the student’s control.
These limitations may include
- International medical schools often reflect even greater diversity in grading schema due to differing lengths of programs, non-standardized curricula, and variations in course content across years.
- IMG transcripts are more likely to have lower resolution (e.g. low-quality photocopies, background distorting grade visibility, or hand-written transcripts that are hard to read by the human eye), unconventional orientations (such as diagonal or upside-down scans), and language translation issues, which can result in errors, misinterpretations and non-standard processing from students applying from the same school during the same academic year.
- IMGs are also more likely to be reapplicants who graduated several years ago—sometimes even 5 to 10 years prior—compared to U.S. graduates, who are typically upcoming or more recent graduates. This discrepancy means that statistically speaking, fewer transcripts from IMGs will be available for any given academic year, leading to smaller sample sizes which will result in smaller grade distributions or no distribution at all if falling below the minimal threshold value described above.
These limitations highlight the inherent challenges in normalization across diverse educational backgrounds and grading systems, underscoring the need for ongoing refinement and consideration of these factors in the transcript normalization process. In other words, while grade normalization provides a more “apples to apples” comparison (vs. “apples to orange,” or “apples to bananas” as the current status quo), these efforts would remain imperfect even if this new technology performed with 100% accuracy across each and every medical school worldwide. Regardless, Thalamus will continue to work through perceived, relative, and absolute limitations in this methodology to innovate based on user feedback, as well as to continue advances in the development of the tool and broader technology at-large.
Hallucinations and Model Misinterpretation
As with all large language models, limits also include a risk of hallucinations — where the system may misinterpret, over-generalize, or fabricate structure from ambiguous transcript data. While safeguards are in place, including prompt engineering, human validation, and error reporting workflows, no model is immune from misclassification. Programs should therefore treat transcript normalization outputs as decision-support only and always confirm critical details against the original transcript when uncertainty arises.
VI. Frequently Asked Questions (FAQs)
General FAQs
Q1. Why did Thalamus AI Insights begin with transcript normalization as its first feature?
A1. Transcript normalization addresses one of the most persistent challenges in GME: the wide variability of medical school transcripts, grading scales, and formats. By standardizing this data, programs gain a clearer, more equitable view of applicant academic performance, while reducing time spent on manual transcript review. AI is also only used in this tool as a data aggregator, aligning with our philosophy that AI should enhance, not supplant human review.
Q2. What updates have been done for the 2026 ERAS Season ?
A2. Enhancements in Cortex Transcript Normalization include:
- Model refinement and upgrade from GPT-4o-mini and to include GPT-5o-mini
- Expanded catalog of medical schools and grading schemas
- Improved real-time processing and validation
Q3. How does this align with Thalamus’ broader AI strategy?
A3. The tool is built according to Artificial Intelligence: The Thalamus Way, emphasizing transparency, fairness, and inclusivity. It reflects Thalamus’ mission as a Public Benefit Corporation to advance equity in medical education while responsibly integrating AI into holistic review.
FAQs for Programs
Q1. Does transcript normalization replace my judgment as a faculty reviewer?
A1. No. Transcript normalization is a decision-support tool. It standardizes and presents transcript data consistently, but faculty judgment and holistic review remain central to evaluating each applicant.
Q2. How are percentiles and grade distributions calculated?
A2. Percentiles are based on the minimally determinable time unit (e.g., semester, trimester, or academic year) so students are compared fairly within their sub-cohort. Grade distributions aggregate as a blended cohort for all applicant grades from that medical school applying in the ERAS cycle.
Q3. How can applicants with the same grade for the same clerkship at the same school have different grade percentile ranks? Does this also happen for grade distribution graphs?
A3. Two (or more) applicants from the same medical school receiving the same core clerkship grade may have different calculated percentiles. This is because grade percentile ranks for each student for each core clerkship is calculated based on the sub-cohort defined by the minimally determinable time unit on each medical school’s transcript (e.g. semester, trimester, or academic year, etc., whichever is shorter). The two students would have taken the courses at different times, thereby are analyzed in separate sub-cohorts and thereby can have different grade percentile ranks.
Grade distribution graphs are created using a blended cohort of students who are applying to ERAS from that medical school. The graph is meant to provide a relative visual position of the student’s performance based on the grade received. Thereby, within each bar/cohort of the histogram, students may also have varying percentiles.
Q4. Why is there sometimes no grade distribution displayed?
A4. To promote reliability and applicant privacy, distribution data is only displayed when at least 10 data points are available for a given core clerkship at a medical school.
For medical schools where there are multiple core clerkships across each specialty/discipline (e.g. Internal Medicine I, Internal Medicine II, Surgery I, Surgery II, etc.), in the current iteration, no percentile graph will display. In this case, each clerkship grade is shown consecutively, concatenated with a comma (e.g. “Internal Medicine H,HP” etc.). In a future iteration, we are working with the community to understand if multiple graphs would provide helpful context.
Q5. How are clustered clerkships or multiple clerkships (e.g., Internal Medicine I & II) handled?
A5. For clustered courses, the grade is mapped across all included clerkships. For multiple courses in the same discipline, grades are concatenated (e.g., “Internal Medicine H, HP”).
Q6. How should I interpret differences between the Thalamus display and a school’s MSPE?
A6. Medical schools vary in how they report data in the MSPE (which students are included, combined degrees, applicants outside ERAS, etc.). Thalamus normalizes only the data provided from applicants to ERAS from that medical school for that application cycle, which may differ from a school’s internal reporting.
Q7. How accurate is the tool, and how do you prevent bias?
A7. Accuracy is ensured through a multi-step process: OCR conversion, LLM classification, and human subject matter expert review. The model is trained and validated with a representative sample of medical schools, including US MD, DO, and selected international schools. Regular sampling and community feedback drive continuous improvement.
Q8. How does the tool handle OCR or scan quality issues?
A8. OCR outputs are validated with quality control checks and manual review. When a transcript scan is too poor for reliable normalization (e.g., handwritten, distorted or low-quality scans), programs receive a “View Transcript” link to access the original. Results from transcripts that also do not meet a certain minimum character threshold (which is a marker of parsing quality) are not displayed and will have the “View Transcript” link displayed.
FAQs for Applicants
Q1. What happens if my school uses a unique or unusual grading system?
A1. Thalamus supports the most common categorical, letter, and numerical scales. If your school’s schema is not yet fully mapped, the system will display a “View Transcript” link so reviewers can access the raw transcript. Mapping is continuously expanded with each recruitment cycle.
Q2. What if my transcript is not included in normalization?
A2. In these cases, programs will still review your transcript holistically and can easily access through the “View Transcript” link. Comparison can still be made on your academic performance as needed, and nearly all programs are still independently reviewing MSPEs and/or raw transcript PDFs as part of human-driven holistic review. This tool was created to assist in organizing and presenting transcript data for human review, not to supplant human review.
Q3. Can programs filter my application in or out based on core clerkship grades or the transcript normalization output?
A3. No. Grades, percentile ranks, and distribution graphs are static data elements for reference only. Programs cannot filter, exclude, or auto-screen applicants based on this information (i.e. no automated decisions are made). The feature is designed solely to supplement human review by providing a consistent, structured way to interpret core clerkship grades.
VI. Conclusion
This novel transcript normalization tool in Thalamus Cortex is now enhanced for the 2026 ERAS season with expanded coverage of applicants, designed with a focus on product inclusivity, accessibility, transparency, and equity. Through this innovation, we have developed a system that aims to enhance the fairness of and efficiency within the residency application process.
We acknowledge the complexity of this task and the importance of maintaining trust with residency program directors and other stakeholders. As such, we remain committed to ongoing refinement and improvement of this tool, informed by user feedback and continuous evaluation.
We invite residency program directors and other stakeholders to provide feedback to help us refine and enhance the tool further. Our goal is to support you in making well-informed, equitable decisions about your residency applicants, to highlight applicant academic performance and to streamline application screening and review.
References
[1] https://www.usmle.org/usmle-step-1-transition-passfail-only-score-reporting
[2] https://www.nbome.org/news/comlex-usa-level-1-to-eliminate-numeric-scores/
[3] Ozair A, Bhat V, Detchou DKE. The US Residency Selection Process After the United States Medical Licensing Examination Step 1 Pass/Fail Change: Overview for Applicants and Educators. JMIR Med Educ. 2023 Jan 6;9:e37069. doi: 10.2196/37069. PMID: 36607718; PMCID: PMC9862334.
[4] https://www.aamc.org/career-development/affinity-groups/gsa/medical-student-performance-evaluation
[5] https://www.aamc.org/data-reports/curriculum-reports/data/clerkship-requirements-discipline
[6] Jeremy M. Lipman, Colleen Y. Colbert, Rendell Ashton, Judith French, Christine Warren, Monica Yepes-Rios, Rachel S. King, S. Beth Bierer, Theresa Kline, James K. Stoller; A Systematic Review of Metrics Utilized in the Selection and Prediction of Future Performance of Residents in the United States. J Grad Med Educ 1 December 2023; 15 (6): 652–668. doi: https://doi.org/10.4300/JGME-D-22-00955.1
[8] https://openai.com/index/gpt-4o-mini-advancing-cost-efficient-intelligence/
[9] https://www.aamc.org/services/member-capacity-building/holistic-review
[10] https://www.mededportal.org/doi/10.15766/mep_2374-8265.11299
Explore our latest insights and updates.